The project economics, market and environmental figures in this article are based on Sierra Energy’s models, third-party sources and assumptions, and are provided for business evaluation and discussion purposes only. They are illustrative, not actual project or distributor results, and not guarantees of future performance. Actual results may differ materially.
FastOx® Gasification Technology
Commercial Value
On an annualized basis, FastOx gasification projects are projected to support compelling project-level economics, including EBITDA relative to CAPEX or Net CAPEX in the 20% to 50% plus range:
Multiple sources of revenue on FastOx gasification projects can support strong project economics, including high-value products, incentives, CO₂ for industrial use or sequestration credits, tipping fees (payments for waste), and green cement additives.
Example project: A 100 MTPD Municipal Solid Waste (MSW)-to-Sustainable Aviation Fuel (SAF) California project is projected to have annualized EBITDA relative to CAPEX of 42%.
Attractive market opportunities for FastOx gasification projects, with high project ROIs in large addressable markets.
Power for AI data centers
Clean hydrogen for zero emission transport and power generation
Renewable methanol and SAF
FastOx gasification projects can be competitive with fossil fuels without incentives.
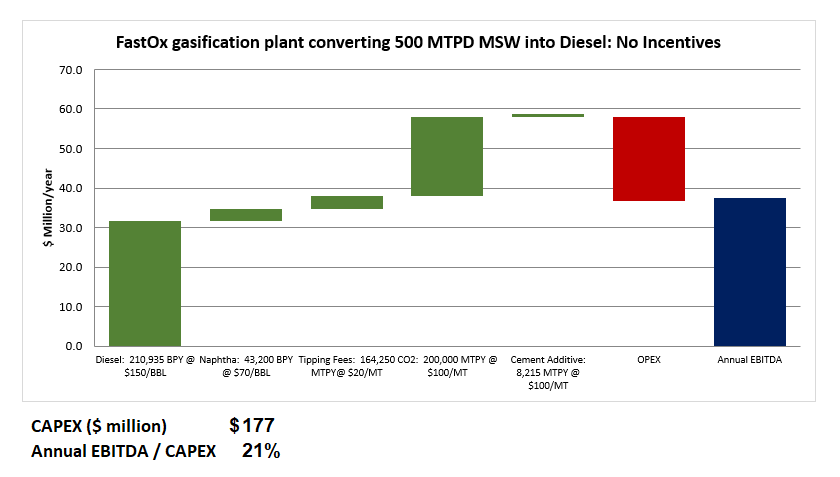
Example: A 500 MTPD MSW-to-diesel project is projected to have annualized EBITDA relative to CAPEX of 21%.
Multiple sources of revenue on FastOx gasification projects
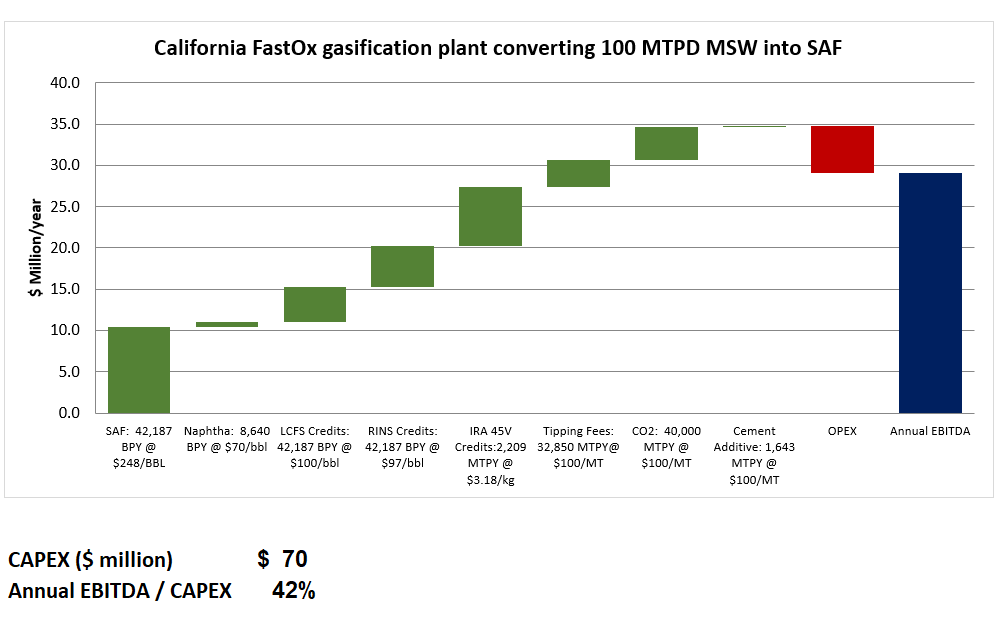
SAF Revenue – From the sale of SAF to airlines
LCFS (Low Carbon Fuel Standard Credits) – California credits for renewable transport fuels
RINS (Renewable Identification Numbers) – EPA credits for renewable transport fuels
IRA 45V (Inflation Reduction Act production Tax Credits) – Federal tax credits for the production of low carbon intensity hydrogen
Tipping Fees (Payments from Waste Haulers) – Payments usually made to landfills for disposal
CO₂ Revenue – From the sale of purified CO₂ into food and beverage markets
Cement Additive Revenue – From the sale of gasifier slag as a clinker replacement in Portland cement
Attractive market opportunities for FastOx gasification projects, with high project ROIs in large addressable markets
Power for AI Data Centers
One particularly promising opportunity is the rapidly growing demand for reliable electricity from data centers, especially facilities supporting artificial intelligence.
Sierra Energy has been approached by multiple data center developers interested in the use of FastOx gasification technology to provide continuous baseload power. Unlike intermittent sources such as solar and wind, FastOx gasification technology is designed to operate around the clock, subject to normal operating and maintenance requirements and the availability of suitable feedstock.
Sierra Energy’s project analyses indicate that FastOx gasification technology can supply power at highly competitive prices in locations where suitable waste supplies, tipping fees, project sites, and power customers can be assembled.
Developers have also expressed interest in the potential for FastOx gasification facilities to be developed and placed into service years sooner than new nuclear generating facilities, which generally require much longer development, licensing, financing, and construction schedules.
A 500 MTPD FastOx gasification plant using MSW as feedstock is projected to produce approximately 50 megawatts of continuous power, with EBITDA relative to Net CAPEX of 51%, and eliminate 270,000 metric tons per year of CO₂e greenhouse gas (GHG) emissions from the atmosphere.
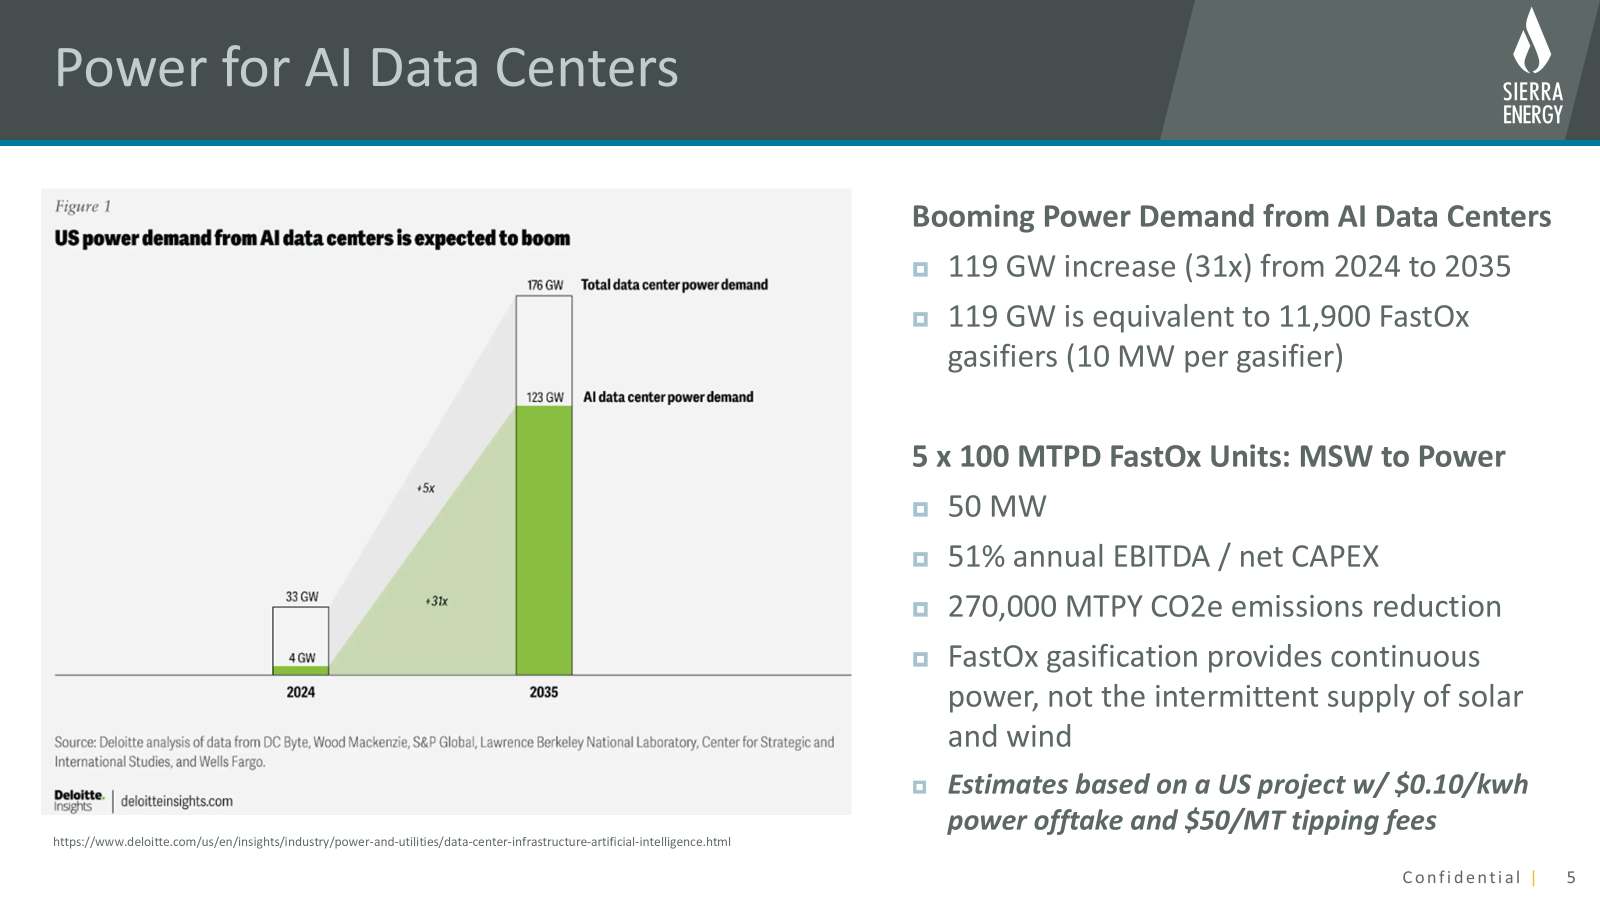
The broader data center power market is growing rapidly. The third party analysis referenced in the graphic above projects a substantial increase in data center power demand through 2035. FastOx gasification would need to capture only a small portion of that growth to support a meaningful number of projects.
Clean hydrogen for zero emission transport and power generation
Syngas produced through the FastOx gasification process can also be used to produce clean hydrogen as an alternative to hydrogen made from conventional fossil fuel processes.
Hydrogen produced from waste could potentially replace diesel fuel in heavy transportation, rail, industrial operations, and other applications. Depending upon local waste economics and hydrogen pricing, Sierra Energy’s project analyses indicate that the FastOx gasification process provides a cost-competitive pathway to hydrogen production. A project consisting of five 100-MTPD FastOx gasification units could produce hydrogen at meaningful commercial scale while reducing emissions associated with both waste disposal and diesel fuel use.
A five-unit, 500 MTPD FastOx hydrogen project using MSW as feedstock is projected to have EBITDA relative to Net CAPEX of 54% and eliminate 325,000 metric tons per year of CO₂e greenhouse gas (GHG) emissions from the atmosphere.
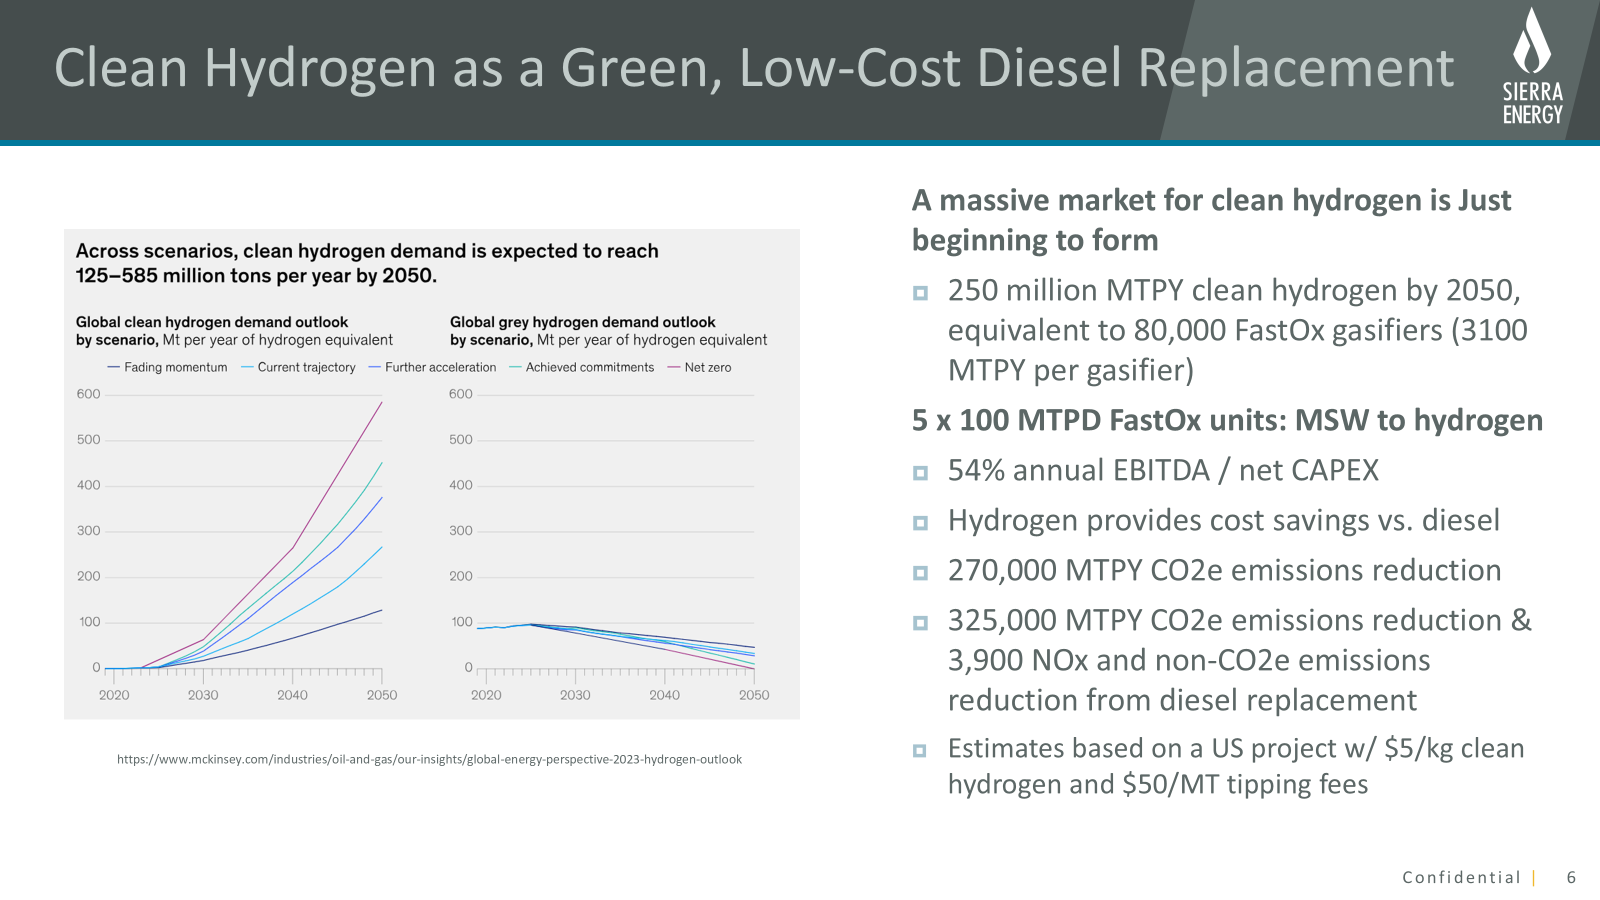
The global market for hydrogen is already substantial and is expected to grow as transportation, industrial, and energy customers seek lower emission alternatives. The portion of that market served by low emission hydrogen remains comparatively small, creating a potentially significant opportunity for technologies capable of producing it economically.
Renewable Methanol and Sustainable Aviation Fuel
Syngas produced through the FastOx gasification process can also provide the building blocks needed to produce renewable methanol and sustainable aviation fuel.
Renewable methanol is becoming increasingly important in the maritime industry as vessel operators face stricter renewable fuel requirements and rising costs associated with continued reliance on conventional marine fuels.
A 400 MTPD FastOx gasification plant using MSW as feedstock is projected to produce approximately 50 megawatts of continuous power, with EBITDA relative to Net CAPEX of 21%, and eliminate 216,000 metric tons per year of CO₂e greenhouse gas (GHG) emissions from the atmosphere.
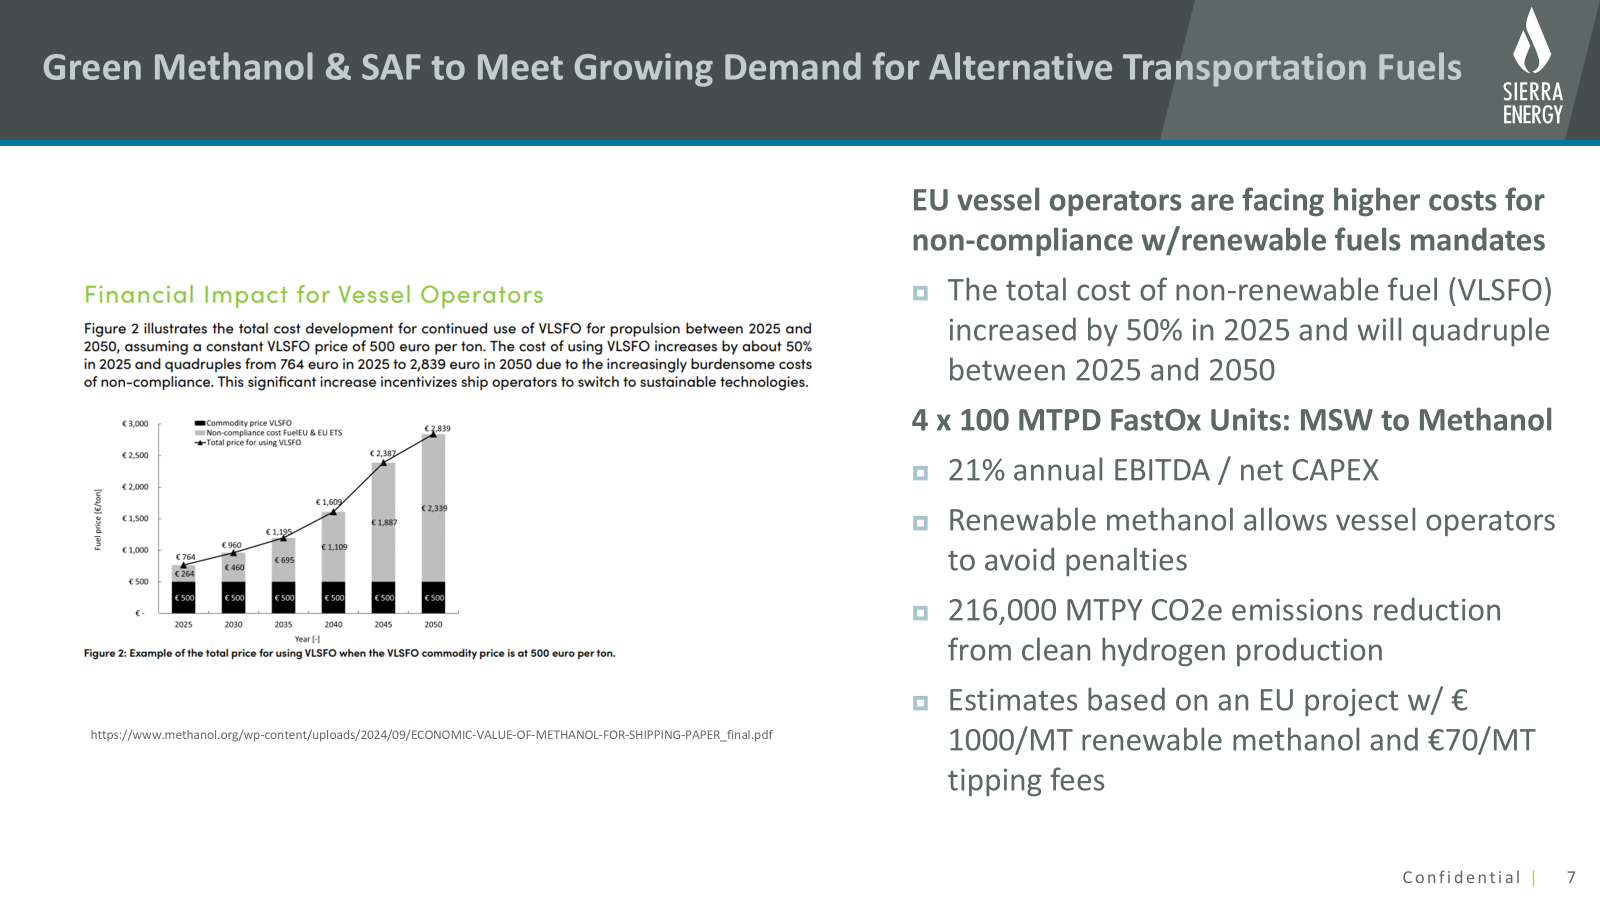
Sustainable aviation fuel represents another potentially large application. Airlines, governments, and fuel producers are seeking scalable alternatives to petroleum-based jet fuel, and syngas produced from waste can serve as an intermediate product in several established fuel production pathways.
FastOx gasification projects can be competitive with fossil fuels without incentives.
FastOx gasification projects can receive tipping fees to accept waste, creating a revenue source that can cover all of the plant’s operating expenses. With sufficient tipping fee revenue, FastOx gasification plants can produce energy and fuel at a lower cost than a competing fossil fuel plant.
The example below shows a 500 MTPD FastOx gasification plant converting MSW into diesel, food-and-beverage-grade CO₂, and a green cement additive. The economics use expected market prices with no additional incentives. The modeled tipping fee is $20/MT, which is conservative relative to regions where tipping fees can exceed $100/MT.
Note: The project economics and environmental figures in this article are based on Sierra Energy’s models and assumptions and are provided for business evaluation and discussion purposes. They are not actual project results, distributor results, territory results, or guarantees of future performance.
Primary document · also published in the TechPipe™ knowledge base ↗.